BlockSync Project

Welcome to the BlockSync Project

This project aims to provide an efficient way to provide mutual protection from deemed bad actors that attack Internet facing servers. The result will be an open source set of communication tools that use established protocols for high speed and light weight transmission of attacker information to a variable number of targets (unicasting to a possibly large number of hosts).

Background

There are many open source firewall technologies in widespread use, most based on either packet filter (pf) or netfilter (iptables). There is much technology that provides network clustering (for example, OpenBSD’s CARP and pfsync; netfilter; corosync and pacemaker), however it’s difficult for disparate (loosely coupled) servers to communicate the identity of attackers in real time to a trusted community of (tightly coupled) peers. Servers or firewalls that use state-table replication techniques, such as pfsync or netfilter, have a (near) real-time view of pass/block decisions other members have made. There needs to be a mechanism for loosely coupled servers to share block decisions in a similar fashion.

Our goal is to create an open source tool for those of us that have multiple Internet facing servers to crowd source information that will block attackers via the firewall technology of choice (OpenBSD/FreeBSD pf/pfSense, iptables, others).

Project Page

All project files are still private yet, but when we publish to GitHub or SourceForge, this section will be updated.

Funding

We have published a GoFundMe page to acquire more lab equipment here at gofundme.com/BlockSync

How To Increase ArcSight ESM Command Center GUI Timeout

In the appliance versions of most ArcSight products, there is the ability to set the user session timeout period. Typically this defaults to somewhere between five (5) and 15 minutes – good for a default but incredibly annoying for any real user.  In ArcSight Enterprise Security Manager (ESM), there is no such GUI configuration that allows modification of the user session timeout – so this is what has worked for me:

Set ArcSight Command Center (ACC) timeout greater than 900 seconds (15 minutes) – set to 28800 seconds (8 hours)
vi /opt/arcsight/manager/config/server.properties
service.session.timeout=28800
/sbin/service arcsight_services stop all
/sbin/service arcsight_services start all

Default is 600 seconds = 5 minutes.

In 6.5, 6.5.1 and 6.8 you also need to add the following for the Logger interface in ESM:

vi /opt/arcsight/logger/userdata/logger/user/logger/logger.properties
server.search.timeout=28800
/sbin/service arcsight_services stop all
/sbin/service arcsight_services start all

Default is 600 seconds = 5 minutes.

Yes, eight (8) hours may seem like a long time, so chose what is appropriate for your site.  🙂

Installation notes for Logger 6 on CentOS

[Update 2016/04/15]:  Installing Logger 6.2 on CentOS 7.1

CentOS (or RHEL) 7 changed a number of things in the OS for command and control, such as the facility to control services – for example, rather than “service” the command is now “systemctl”.  Below I outline a “quickstart” way to get HPE ArcSight Logger 6.2 installed on CentOS 7.1 (minimal distribution). Of course you want to read the Logger Installation Guide, Chapter 3 “Installing Software Logger on Linux” for the complete instructions and be sure you understand the commands I suggest below before you run them. No warranties here, just suggestions.  😉

  1. Do a base install of CentOS (or RHEL) 7.1, minimal packages.  I often suggest adding in Compatibility Libraries, however for this Logger 6.2 install, I just used the base install.  Ensure /tmp has at least 5GB of free space and /opt/arcsight has at least 50GB of usable space – I’d suggest going with at least:
    • /boot – 500MB
    • / – 8GB+
    • swap – 6GB+
    • /opt – 85GB+
  2. Ensure some needed (and helpful) utilities are installed, since the minimal distribution does not include these and unfortunately the Logger install script just assumes they are there .. if they aren’t, the install will eventually fail (such as no unzip binary).
    • yum install -y bind-utils pciutils tzdata zip unzip
    • Unlike my ESM install, for Logger, I left SELinux enabled and things appear to be working alright, but your mileage may vary.  If in doubt, disable it and try again.  To disable, edit /etc/selinux/config and set the mode to “disable” (or at least to “permissive”)
    • Disable the netfilter firewall (again, at some point I’ll update this with the rules needed to leave netfilter enabled).
    • systemctl disable firewalld; systemctl mask firewalld
    • Install and configure NTP
    • yum install -y ntpdate ntp
    • (optionally edit /etc/ntp.conf to select the NTP servers you want your new Logger system to use)
    • systemctl enable ntpd; systemctl start ntpd
    • Edit /etc/rsyslog.conf and enable forwarding of syslog events to your friendly neighborhood syslog SmartConnector (optional, but otherwise how do you monitor your Logger installation?) .. you can typically just uncomment the log handling statements at the bottom of the file and fill in your syslog SmartConnector hostname or IP address. Note the forward statement I use only has a single at sign – indicating UDP versus TCP designated by two at signs:
    • $ActionQueueFileName fwdRule1 # unique name prefix for spool files
      $ActionQueueMaxDiskSpace 1g # 1gb space limit (use as much as possible)
      $ActionQueueSaveOnShutdown on # save messages to disk on shutdown
      $ActionQueueType LinkedList # run asynchronously
      $ActionResumeRetryCount -1 # infinite retries if host is down
      # remote host is: name/ip:port, e.g. 192.168.0.1:514, port optional
      #*.* @@remote-host:514
      *.* @10.10.10.5:514
    • Restart rsyslog after updating the conf file
    • systemctl restart rsyslog
    • Optionally add some packages that support trouble shooting or other non-Logger functions you run on the Logger server, such as system monitoring
    • yum install -y mailx tcpdump
  3. Update the maximum number of processes and open files our Logger software can use:
    Backup the current settings:
    cp /etc/security/limits.d/20-nproc.conf /etc/security/limits.d/20-nproc.conf.orig
    Drop in new config file (assuming you have copy/pasted the following settings into /root/20-nproc.conf):
    cp 20-nproc.conf /etc/security/limits.d/20-nproc.confContents of the /etc/security/limits.d/20-nproc.conf file becomes:
    # Default limit for number of user's processes to prevent
    # accidental fork bombs.
    # See rhbz #432903 for reasoning.
    * soft nproc 10240
    * hard nproc 10240
    * soft nofile 65536
    * hard nofile 65536
    root soft nproc unlimited

    Reboot to enable the new settings.
  4. Add an unprivileged user “arcsight” to own the application and run as:
    groupadd -g 1000 arcsight
    useradd -u 1000 -g 1000 -d /home/arcsight -m -c "ArcSight" arcsight
    passwd arcsight
  5. Ensure the *parent* directory for the Logger software exists. Standard locations for installation of ArcSight products should be /opt/arcsight, so for example, we’re going to install our Logger software at /opt/arcsight/logger.
    cd /opt
    mkdir /opt/arcsight
  6. Run the Logger installation binary as “root” user
    • ./ArcSight-logger-6.2.0.7633.0.bin
  7. After the installation script completes successfully, you should be able to login to the console via a web browser https://<hostname>
    Default username “admin” with default password “password”. You’ll be forced to change the admin password on login.
  8. If you are going to install any SmartConnectors on the system hosting your Logger, check out my post regarding required libraries for CentOS and RedHat, before you try to run the Linux SmartConnector install. This includes any Model Import Connectors (MIC) or forwarding connectors (SuperConnectors).


[Update 2016/03/11]: Starting with SmartConnector 7.1.7 (I think, might be a rev or two earlier), there are a couple more libraries that are needed to successfully install the SmartConnector on Linux. Include libXrender.i686 libXrender.x86_64 libgcc.i686 libgcc.x86_64
yum install libXrender.i686 libXrender.x86_64 libgcc.i686 libgcc.x86_64

These notes describe an installation of HP ArcSight Logger 6.0.1 on a CentOS 6.5 virtual machine.

For a test install of Logger 6, I built a CentOS vm with the following parameters:
Basic install from the CentOS 6.5 Minimum ISO
1 CPU with 2 cores
4GB memory
80GB virtual disk
1 bridged network adapter
Disk partition sizes:
root fs 6GB, swap 4GB, /home 2GB, /opt/arcsight 50GB, /archive 10GB, free space approximately 15GB

As soon as the system was up, I commented out the archive filesystem (will be re-mounted under the /opt/arcsight/logger directory)
vi /etc/fstab

Installed the bind-utils package so I could use dig and friends, then did a full yum update:
yum install bind-utils ntp
yum update

This turns the system into CentOS 6.6, but that’s still a supported system for Logger, so all’s good.

Next we prepare the system for Logger software install by adding a user and changing some of the system configuration.

Add a non-root user to own and run the Logger application:
groupadd -g 1000 arcsight
useradd -u 1000 -g 1000 -d /home/arcsight -m -c "ArcSight" arcsight
passwd arcsight

Install libraries that Logger depends on:
yum install glibc.i686 libX11.i686 libXext.i686 libXi.i686 libXtst.i686
yum install zip unzip

Update the maximum number of processes and open files our Logger processes can have:
cp 90-nproc.conf /etc/security/limits.d/90-nproc.conf

Contents of the /etc/security/limits.d/90-nproc.conf file becomes:
# Default limit for number of user's processes to prevent
# accidental fork bombs.
# See rhbz #432903 for reasoning.
*          soft    nproc     10240
*          hard    nproc     10240
*          soft    nofile    65536
*          hard    nofile    65536
root       soft    nproc     unlimited

Turn off services we don’t need and turn on the ones we do need. Later we will write some iptables rules so we can turn the firewall back on when we’re done.

chkconfig iptables off
service iptables stop
chkconfig iscsi off
service iscsi stop
chkconfig iscsid off
service iscsid stop
ntpdate name-of-ntp-server-you-trust
chkconfig ntpd on
service ntpd start

All of these steps are packaged up here in centos-setup.shl:
groupadd -g 1000 arcsight
useradd -u 1000 -g 1000 -d /home/arcsight -m -c "ArcSight" arcsight
passwd arcsight
cp 90-nproc.conf /etc/security/limits.d/90-nproc.conf
yum install glibc.i686 libX11.i686 libXext.i686 libXi.i686 libXtst.i686
yum install zip unzip
chkconfig iptables off
service iptables stop
chkconfig iscsi off
service iscsi stop
chkconfig iscsid off
service iscsid stop
ntpdate 0.centos.pool.ntp.org
chkconfig ntpd on
service ntpd start

Turns out since we need 3+GB of free space in /tmp, I needed to extend the root filesystem .. I only allocated 2GB to begin with. Extend the root logical volume (lv_root) by adding 1,000 Physical Extents (4MB each):

Boot into rescue mode .. do NOT mount linux partitions, then drop to a shell

vgs
vgchange -a y vg_swlogger1
lvextend -l +1000 /dev/vg_swlogger1/lv_root
e2fsck -f /dev/vg_swlogger1/lv_root
resize2fs /dev/vg_swlogger1/lv_root

Now reboot and confirm there is at least 4GB of free space in /tmp. Could also have mounted a ram filesystem, but this will do as I’m conserving my memory on the host.

Upload the Logger installer binary and also the license file to the system into root’s home directory (or where you have space).

As root, run the Logger software install:
chmod u+x ArcSight-logger-6.0.0.7307.1.bin
./ArcSight-logger-6.0.0.7307.1.bin

Word of advice .. if doing this in a vm, run the install from the vm console since it’s possible the vm will be busy enough a remote ssh session could get disconnected – and the install will not complete properly.

After the install, we should be able to open a browser by navigating to https://name-of-vm-here

Sign in as arcsight / password then navigate to the System Administration section to change the admin password.

Creating event replay files for ArcSight SmartConnectors

The ArcSight connector framework includes the capability to record event replay files from inbound event streams, regardless of the type of event data. This is enormously useful for development and testing individual of use cases, demonstrations and training. The following article is based on ArcSight SmartConnector version 7.0.7.

Events are replayed back to the target destinations by selecting some variety of previously recorded replay files using an ArcSight Test SmartConnector. Either multiple event files or a consolidated file can be used with the Test Alert connector. Since the Test Alert connector is a standard SmartConnector, multiple destinations can be configured, such as to Enterprise Security Manager (ESM) and/or Logger. As event files are replayed back into the target(s), the timestamp can be the original or can be overridden to the current time. This enables historical analysis as well as event data appropriate for any time sensitive rules or use cases.

Create Replay File Directly From Connector

1. Shut down Connector Service.
2. Open the .../current/user/agent/agent.properties file, add following two properties to agent.properties file:

agent.component.count=36
agent.component[35]=com.arcsight.agent.loadable._RecordComponent

agent.properties replay configuration

3. Start Connector Service again

The Connector will start capturing events being sent to ESM, writing the output to .../current/replayagent/{agent-id}.sessions

4. Stop the Connector when you are done capturing events
5. Open the agent.properties file again and remove or comment out the lines added in step 2, then restart the connector again
6. Rename the .sessions file to .events and copy it to the …/current directory of the Testalert SmartConnector and start (or restart) the Test Alert SmartConnector.
7. Start Test Alert to replay the file.

Testalert Connector

Once the replay file or files are selected, the events can be replayed into the system with a specified Event Per Second (EPS) rate

replay-event-rate

Optimizing the Collection and Replay

By default, the Test Alert SmartConnector will replay the recorded events with a current timestamp.  Where it is desirable to replay the events with the original timestamp, the connector can be configured through the normal connector reconfiguration (…/current/bin/runagentsetup.sh)

One of the disadvantages of this approach is apparent if using this method to collect sample event data that would not normally be directed to your ESM instance. On the source SmartConnector, the destination can be set to be a CSV file – enabling the ability to turn very large event feeds directly into .event files without using any ESM storage and processing capacity.

Replaying Events with Original Timestamps

To enable replay of the recorded events with their original timestamps, edit the .../current/user/agent/agent.properties file and add or uncomment out the following lines:

agents[0].preserveagenttime=true
agents[0].preservedetecttime=true

When the Test Alert SmartConnector starts again, the events will be replayed with original timestamps.
 

Building a Highly-Available ArcSight SmartConnector Cluster with Pacemaker

Cost Effective SmartConnector HA

This paper describes the use of open source clustering software used to build a low-cost, reliable, high availability environment on CentOS Linux in which to run both passive and active SmartConnectors, providing automated failure recovery.

Introduction

At current time there is no inherent High-Availability capability for ArcSight SmartConnector installations other than HA management of connectors through multiple Connector Appliances. Once events have been acquired by a SmartConnector, the store-and-forward architecture provides a reliable event handling ecosystem, but the problem is what to do when a specific SmartConnector, or the system it is running on, fails. Traditionally customers would procure and employ hardware load balancers in front of SmartConnector Connector Appliances or Connector Concentrators, although that only really deals with passive connectors, such as syslog, SNMP or other listeners. Active connectors such as Windows, Database readers, etc would require a manual failure recovery in order to restore the service of event collection. Although customers can use commercial clustering technology, such as Veritas Cluster Server, those tools can require substantial capital investment. This paper describes the use of open source clustering software used to build a low-cost, reliable, high availability environment in which to run both passive and active SmartConnectors, providing active failure recovery and service continuance. This configuration is not endorsed or supported by HP Enterprise Security Products and is provided for informational purposes only.

This package includes documentation and scripts to setup a cluster from scratch in an automated manner. Access to cluster packages in CentOS or local customer provided repositories is needed by the setup scripts. Users of this package need to obtain a Linux binary of the HP ArcSight SmartConnector software – it is not included. The result of the included quickstart script will be a functional cluster with a syslog SmartConnector running and able to fail-over to a partner node in the case of primary node failure. The two cluster nodes must have at least two (2) network segments, although all traffic to/from the event sources can be on any customer network that is reachable via standard IPv4 routing – the cluster does not operate in-line but rather as a distinct IP node on the customer network.

Assuming a relatively fast connection to the Internet, or internal servers, for access to the CentOS software repositories, the quickstart script can complete the cluster setup in less than 15 minutes, but one should expect to take a day to review the cluster configuration, commands and proper operating procedures. Recovery from incorrect cluster commands or operations will almost assuredly require a cluster outage for re-configuration, resync or worse, backup/recovery. Given the relative low cost of simple 1U servers, it is strongly recommended that two pairs of nodes are used to create a test cluster and production cluster. Modest VMware or other virtual servers can be used to implement the test environment. TCP/UDP protocol ports that are used are specific to the unique cluster IP addresses, so there should not be any collisions – although care must be taken to choose unique multicast addresses for the cluster communication provided by corosync. This is not done automatically by the quickstart scripts.

Feed back is welcomed, both success stories and problems/bugs that are encountered, but users need to self-support any implementations. The current maintainer is Allen Pomeroy (a at pomeroy dot us)

Download the Whitepaper and Cluster setup scripts in this zip file: BuildingAHASmartConnectorCluster-2.0.6

How to replay syslog events using the performance testing feature of ArcSight SmartConnectors

Aside

[Updated 2016/08/22]

For testing ArcSight SmartConnector settings or Logger and Enterprise Security Manager (ESM) content, it is quite useful to be able to replay previously captured syslog events.  The built in PerfTestSyslog class in ArcSight SmartConnectors make this easy.

There are several ways to capture syslog traffic into a text file for use in replay scenarios. Below are some methods that I have used – may not be the most elegant, but gets the job done.

Run a packet capture of syslog traffic

On the node that has inbound syslog traffic, run a packet capture using tcpdump:syslog-simulator

tcpdump -nn -i eth0 -s0 -w syslog-traffic.pcap port 514

where eth0 is the network interface receiving the syslog traffic, syslog-traffic.pcap is the resulting pcap format output file of captured events and 514 is the port that syslog traffic is expected to be received.

After capturing a suitable size of events, import the pcap file into Wireshark, click on one of the syslog packets, right click and select Follow UDP stream. A decoded content window will appear where you can select Save As .. and dump it to a sample events file. Ensure to select ASCII versus Raw format. This will be your event input file to feed the PerfTestSyslog function of the ArcSight SmartConnector.

Replaying the syslog events using an ArcSight SmartConnector is controlled via the GUI that is displayed when the PerfTestSyslog class is launched. In my example, I have a Test Connector installed on my current host (RedHat Enterprise Linux, however Windows, Solaris or AIX would work just as well) in the /opt/agents/syslog-udp-1514 directory. This connector is up and running listening on UDP 1514 for syslog messages, however we are also going to use it to feed the syslog event to the same connector. Just think of it in two separate unrelated processes, since you could just as easily use this to feed the syslog events to another host somewhere on the network.

cd /opt/agents/syslog-udp-1514/current/bin
./arcsight agent runjava com.arcsight.agent.loadable._PerfTestSyslog -H 127.0.0.1 -P 1514 -f ~arcsight/udp.txt -x 50

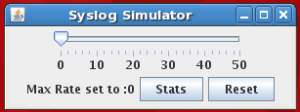
In this example, we are launching the connector framework (./arcsight) and telling the PerfTestSyslog class to read the ~arcsight/udp.txt file (our previously saved syslog events captured with tcpdump) and send them to Host 127.0.0.1 on Port 1514. The last argument is interesting – it configures a slider allowing the user to dynamically increase the Event Per Second (EPS) rate up to a maximum of (in our case) 50 EPS.

A sample capture file has events that look like:

<190>Jun 27 2012 12:16:53: %PIX-6-106015: Deny TCP (no connection) from 10.50.215.102/15603 to 2.3.4.5/80 flags FIN ACK  on interface outside

You can also eliminate the original timestamp if you chose:

%PIX-6-106015: Deny TCP (no connection) from 10.50.215.102/15605 to 204.110.227.10/80 flags FIN ACK  on interface outside

The PerfTestSyslog class has a number of pretty useful options, including -m to randomize the Device Address. This is really good for faking events from multiple firewalls.

Various configuration options exist on both the receiving SmartConnector (that is listening on UDP 1514) and the transmitting program, including the ability to keep the original timestamp intact or replace it with current time. This is especially useful for testing new content or performing historical analysis on previously saved event data where the original timestamp is needed.

Update:

For situations where you would like to run this without a GUI, you can add the -n option to start with No GUI.  In that case, although the rate is no longer dynamic, you do need to specify a starting event rate otherwise it appears the default is 0 .. eg. no events will be sent.  Instead of only specifying -x for max rate, also specify the starting rate with -r

./arcsight agent runjava com.arcsight.agent.loadable._PerfTestSyslog -H 127.0.0.1 -P 1514 -f ~arcsight/udp.txt -n -r 50 -x 50

See also: Common ArcSight Command Line Operations

Securing Apache web servers

Great article by Pete Freitag on Securing Apache Web Servers
(20 ways to Secure your Apache Configuration)

Here are 20 things you can do to make your apache configuration more secure.

Disclaimer: The thing about security is that there are no guarantees or absolutes. These suggestions should make your server a bit tighter, but don’t think your server is necessarily secure after following these suggestions.

Additionally some of these suggestions may decrease performance, or cause problems due to your environment. It is up to you to determine if any of the changes I suggest are not compatible with your requirements. In other words proceed at your own risk.

First, make sure you’ve installed latest security patches

There is no sense in putting locks on the windows, if your door is wide open. As such, if you’re not patched up there isn’t really much point in continuing any longer on this list.

Hide the Apache Version number, and other sensitive information.

By default many Apache installations tell the world what version of Apache you’re running, what operating system/version you’re running, and even what Apache Modules are installed on the server. Attackers can use this information to their advantage when performing an attack. It also sends the message that you have left most defaults alone.

There are two directives that you need to add, or edit in your httpd.conf file:

ServerSignature Off
ServerTokens Prod

The ServerSignature appears on the bottom of pages generated by apache such as 404 pages, directory listings, etc.

The ServerTokens directive is used to determine what Apache will put in the Server HTTP response header. By setting it to Prod it sets the HTTP response header as follows:

Server: Apache

If you’re super paranoid you could change this to something other than “Apache” by editing the source code, or by using mod_security (see below).

Continue reading

90 Day Plan for New IT Security Managers

You’ve just taken over as an information security director, manager, or architect at an organization. Either this is a new organization that has never had this role before or your predecessor has moved on for some reason. Now what? The following outlines steps that have been shown to be effective (also based on what’s been ineffective) getting traction and generating results within the first three months. Once some small successes are under your belt, you can grow the momentum to help the business grow faster or reduce the risk to their success (or both).

Now what do we do?

Apply a tried and true multi phase approach .. assess current state, determine desired target state, perform a gap analysis, implement improvements based on priority. Basically we need to establish current state, determine what future state should be, and use the gap analysis as the deliverables of the IT security program. There may be many trade-offs that are made due to limiters like political challenges, funding constraints and difficulty in changing corporate culture. The plan you build with the business gives you the ammunition needed to persuade all your stakeholders of the value in the changes you’ll be proposing.

1. Understand the Current Environment

For a manager or enterprise architect to determine where to start, a current state must be known. This is basically an inventory of what IT security controls, people and processes are in place. This inventory is used to determine what immediately known risks and gaps from relevant security control frameworks exist. The known risks and gaps gives us a starting point to understand where impacts on the business may originate from.

Take the opportunity to socialize foundational security concepts with your new business owners and solicit their input. What are the security related concerns they have? If there has been any articulation of Strengths, Weaknesses, Opportunities, and Threats (SWOT), obtaining that review can also give you an idea of weaknesses or threats that are indicative of missing controls. In the discussions with your new constituents, talk to the infrastructure managers and ask them what security related concerns keep them awake at night – there is likely some awareness but they don’t know how to move forward. Keep in mind most organizations will want a pragmatic approach versus an ivory tower perfect target state.

Some simple questions can quickly give you a picture of the state of security controls. For example, in organizations I’ve worked with, the network administrators could not provide me a complete “layer three” diagram – a diagram that shows all the network segments and how they hang together. It wasn’t that they didn’t want to, the diagrams simply didn’t exist. With over 1,500 network nodes over two data centers and two office complexes, the network group had the topology and configuration “in their heads”. Obvious weaknesses and threats include prevention of succession planning or disaster recovery, poor security transparency, and making nearly any change to the environment higher risk than necessary.

Continue reading

Security tools

This is a (non-comprehensive) list of the various security tools I have used. I started this list to keep track of tools that I've tried out and the level of satisfaction with them. Obviously there are hundreds of tools that any IT security professional uses throughout their career, so I'm just starting to put down the most recent, interesting or particularly effective. As I have time, I'll update and add comments/reviews/examples as well as break this into categories as the list grows.

Assessment / Attack Tools

Web Application Attack and Audit Framework (w3af)  w3af.sourceforge.net

IBM Rational AppScan  www-01.ibm.com/software/awdtools/appscan

Samurai Web Testing Framework samurai.inguardians.com

Visualization Tools

SecViz Security Visualization (davix) www.secviz.org/node/89

Password Tools

L0phtcrack  www.l0phtcrack.com

Forensics

V3RITY Oracle Database Forensics (www.v3rity.com/v3rity.php)  – "V3RITY is a tool that can be used in an Oracle forensics investigation of a suspected breach. It is the first of its kind and is currently in the beta stages of development."

Epitome of bad software

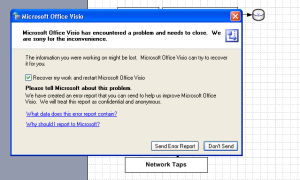
There is a reason many people loathe Microsoft software. Before you consider flaming me for that statement, I realize all software has flaws, bugs and eventually crashes. In my experience, even if it’s patched and up to date, the following image happens FAR too frequently with Microsoft software.
Microsoft bugs
I don’t recall having the same issues with Concept Draw, even with complex diagrams. Since I’m just tired of having to redo work over again, good-bye Visio, I’ve just purchased your replacement.