[Updated 2016/08/22]
For testing ArcSight SmartConnector settings or Logger and Enterprise Security Manager (ESM) content, it is quite useful to be able to replay previously captured syslog events. The built in PerfTestSyslog class in ArcSight SmartConnectors make this easy.
There are several ways to capture syslog traffic into a text file for use in replay scenarios. Below are some methods that I have used – may not be the most elegant, but gets the job done.
Run a packet capture of syslog traffic
On the node that has inbound syslog traffic, run a packet capture using tcpdump:
tcpdump -nn -i eth0 -s0 -w syslog-traffic.pcap port 514
where eth0 is the network interface receiving the syslog traffic, syslog-traffic.pcap is the resulting pcap format output file of captured events and 514 is the port that syslog traffic is expected to be received.
After capturing a suitable size of events, import the pcap file into Wireshark, click on one of the syslog packets, right click and select Follow UDP stream. A decoded content window will appear where you can select Save As .. and dump it to a sample events file. Ensure to select ASCII versus Raw format. This will be your event input file to feed the PerfTestSyslog function of the ArcSight SmartConnector.
Replaying the syslog events using an ArcSight SmartConnector is controlled via the GUI that is displayed when the PerfTestSyslog class is launched. In my example, I have a Test Connector installed on my current host (RedHat Enterprise Linux, however Windows, Solaris or AIX would work just as well) in the /opt/agents/syslog-udp-1514 directory. This connector is up and running listening on UDP 1514 for syslog messages, however we are also going to use it to feed the syslog event to the same connector. Just think of it in two separate unrelated processes, since you could just as easily use this to feed the syslog events to another host somewhere on the network.
cd /opt/agents/syslog-udp-1514/current/bin

./arcsight agent runjava com.arcsight.agent.loadable._PerfTestSyslog -H 127.0.0.1 -P 1514 -f ~arcsight/udp.txt -x 50
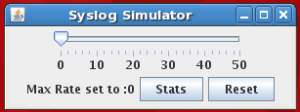
In this example, we are launching the connector framework (./arcsight) and telling the PerfTestSyslog class to read the ~arcsight/udp.txt file (our previously saved syslog events captured with tcpdump) and send them to Host 127.0.0.1 on Port 1514. The last argument is interesting – it configures a slider allowing the user to dynamically increase the Event Per Second (EPS) rate up to a maximum of (in our case) 50 EPS.
A sample capture file has events that look like:
<190>Jun 27 2012 12:16:53: %PIX-6-106015: Deny TCP (no connection) from 10.50.215.102/15603 to 2.3.4.5/80 flags FIN ACK on interface outside
You can also eliminate the original timestamp if you chose:
%PIX-6-106015: Deny TCP (no connection) from 10.50.215.102/15605 to 204.110.227.10/80 flags FIN ACK on interface outside
The PerfTestSyslog class has a number of pretty useful options, including -m to randomize the Device Address. This is really good for faking events from multiple firewalls.
Various configuration options exist on both the receiving SmartConnector (that is listening on UDP 1514) and the transmitting program, including the ability to keep the original timestamp intact or replace it with current time. This is especially useful for testing new content or performing historical analysis on previously saved event data where the original timestamp is needed.
Update:
For situations where you would like to run this without a GUI, you can add the -n option to start with No GUI. In that case, although the rate is no longer dynamic, you do need to specify a starting event rate otherwise it appears the default is 0 .. eg. no events will be sent. Instead of only specifying -x for max rate, also specify the starting rate with -r
./arcsight agent runjava com.arcsight.agent.loadable._PerfTestSyslog -H 127.0.0.1 -P 1514 -f ~arcsight/udp.txt -n -r 50 -x 50
See also: Common ArcSight Command Line Operations
